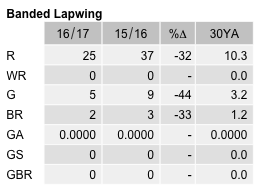
Banded Lapwing
Vanellus tricolor
ABR description
The following is extracted from the Annual Bird Report for the twelve months to June 2017.
Rare, breeding visitor
Occasionally sighted in the ACT in short grasses, but mostly around LBath.
General: Fewer records this year, 2 records from Hoskinstown (BuM1 & DaC2), with 11 from LBath (LeM1). There were 10 sightings of between 2 and 17 birds at the Anderson VC rest area on LGeo in Oct-Nov. Max 56/16 Nov LBath E (LeM1), mean 12, and median 8. In contrast to last year most records were in spring (72%) and summer (24%). 2 breeding records at 2 sites: on/9 Nov LBath E and dy/9 Nov LBath W, both (LeM1).
Abundance
Abundance is the average number of birds of that species per survey. Where the species was observed (presence recorded) but the number of birds seen was not recorded, this is treated as a count of zero.
Abundance by year
This chart shows the abundance of Banded Lapwing between 1982 and 2017. 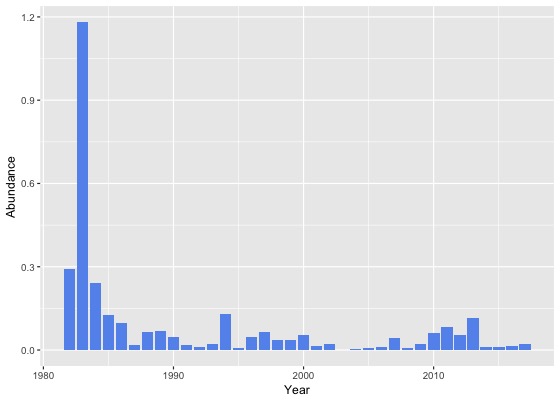
Abundance by month
This chart shows the monthly abundance of Banded Lapwing. The blue lines show the abundance for the twelve months to June 2017 and the bars show the average abundance for the period 1982 to 2017. 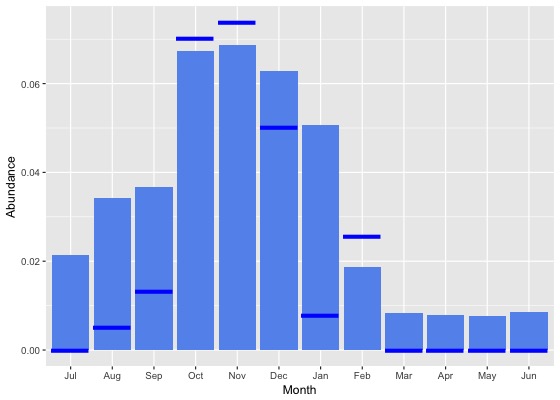
Abundance by season
This chart shows the seasonal abundance of Banded Lapwing. The blue lines show the seasonal abundance for the twelve months to June 2017 and the bars show the average seasonal abundance for the period 1982 to 2017. 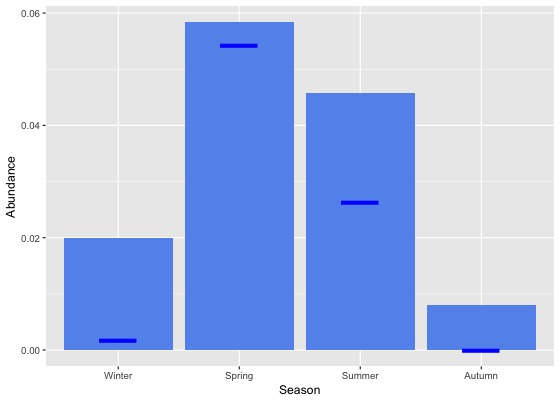
Abundance data
| Month | Season | ||||||||||||||||||
|---|---|---|---|---|---|---|---|---|---|---|---|---|---|---|---|---|---|---|---|
| Period | Jul | Aug | Sep | Oct | Nov | Dec | Jan | Feb | Mar | Apr | May | Jun | Winter | Spring | Summer | Autumn | All | ||
| All years | |||||||||||||||||||
| All | 0.0 | 0.0 | 0.0 | 0.1 | 0.1 | 0.1 | 0.1 | 0.0 | 0.0 | 0.0 | 0.0 | 0.0 | 0.0 | 0.1 | 0.0 | 0.0 | 0.0 | ||
| Previous years | |||||||||||||||||||
| All previous years | 0.0 | 0.0 | 0.0 | 0.1 | 0.1 | 0.1 | 0.1 | 0.0 | 0.0 | 0.0 | 0.0 | 0.0 | 0.0 | 0.1 | 0.0 | 0.0 | 0.0 | ||
| Previous 30 years | 0.0 | 0.0 | 0.0 | 0.1 | 0.1 | 0.1 | 0.1 | 0.0 | 0.0 | 0.0 | 0.0 | 0.0 | 0.0 | 0.1 | 0.0 | 0.0 | 0.0 | ||
| Previous 20 years | 0.0 | 0.0 | 0.0 | 0.1 | 0.1 | 0.1 | 0.1 | 0.0 | 0.0 | 0.0 | 0.0 | 0.0 | 0.0 | 0.0 | 0.0 | 0.0 | 0.0 | ||
| 10 year groups | |||||||||||||||||||
| [2007,2017) | 0.0 | 0.1 | 0.0 | 0.1 | 0.1 | 0.1 | 0.1 | 0.0 | 0.0 | 0.0 | 0.0 | 0.0 | 0.0 | 0.1 | 0.0 | 0.0 | 0.0 | ||
| [1997,2007) | 0.0 | 0.0 | 0.0 | 0.0 | 0.0 | 0.0 | 0.1 | 0.0 | 0.0 | 0.0 | 0.0 | 0.0 | 0.0 | 0.0 | 0.0 | 0.0 | 0.0 | ||
| [1987,1997) | 0.0 | 0.0 | 0.0 | 0.1 | 0.1 | 0.0 | 0.1 | 0.0 | 0.0 | 0.0 | 0.0 | 0.0 | 0.0 | 0.1 | 0.0 | 0.0 | 0.0 | ||
| 5 year groups | |||||||||||||||||||
| [2012,2017) | 0.0 | 0.1 | 0.1 | 0.1 | 0.1 | 0.0 | 0.0 | 0.0 | 0.0 | 0.0 | 0.0 | 0.0 | 0.0 | 0.1 | 0.0 | 0.0 | 0.0 | ||
| [2007,2012) | 0.0 | 0.0 | 0.0 | 0.0 | 0.0 | 0.1 | 0.1 | 0.1 | 0.0 | 0.0 | 0.0 | 0.0 | 0.0 | 0.0 | 0.1 | 0.0 | 0.0 | ||
| [2002,2007) | 0.0 | 0.0 | 0.0 | 0.1 | 0.0 | 0.0 | 0.0 | 0.0 | 0.0 | 0.0 | 0.0 | 0.0 | 0.0 | 0.0 | 0.0 | 0.0 | 0.0 | ||
| [1997,2002) | 0.0 | 0.0 | 0.1 | 0.0 | 0.1 | 0.1 | 0.1 | 0.0 | 0.0 | 0.0 | 0.0 | 0.0 | 0.0 | 0.0 | 0.1 | 0.0 | 0.0 | ||
| [1992,1997) | 0.0 | 0.0 | 0.0 | 0.1 | 0.1 | 0.1 | 0.1 | 0.0 | 0.1 | 0.1 | 0.0 | 0.0 | 0.0 | 0.1 | 0.1 | 0.0 | 0.0 | ||
| [1987,1992) | 0.0 | 0.0 | 0.1 | 0.1 | 0.1 | 0.0 | 0.0 | 0.0 | 0.0 | 0.0 | 0.0 | 0.0 | 0.0 | 0.1 | 0.0 | 0.0 | 0.0 | ||
| Year | |||||||||||||||||||
| 2017 | 0.0 | 0.0 | 0.0 | 0.1 | 0.1 | 0.1 | 0.0 | 0.0 | 0.0 | 0.0 | 0.0 | 0.0 | 0.0 | 0.1 | 0.0 | 0.0 | 0.0 | ||
| 2016 | 0.1 | 0.1 | 0.0 | 0.0 | 0.0 | 0.0 | 0.0 | 0.0 | 0.0 | 0.0 | 0.0 | 0.0 | 0.1 | 0.0 | 0.0 | 0.0 | 0.0 | ||
| 2015 | 0.0 | 0.0 | 0.0 | 0.0 | 0.0 | 0.0 | 0.0 | 0.0 | 0.0 | 0.0 | 0.0 | 0.0 | 0.0 | 0.0 | 0.0 | 0.0 | 0.0 | ||
| 2014 | 0.0 | 0.0 | 0.1 | 0.0 | 0.0 | 0.0 | 0.0 | 0.0 | 0.0 | 0.0 | 0.0 | 0.0 | 0.0 | 0.0 | 0.0 | 0.0 | 0.0 | ||
| 2013 | 0.0 | 0.2 | 0.2 | 0.3 | 0.4 | 0.1 | 0.0 | 0.0 | 0.0 | 0.0 | 0.0 | 0.0 | 0.1 | 0.3 | 0.1 | 0.0 | 0.1 | ||
| 2012 | 0.0 | 0.0 | 0.0 | 0.1 | 0.0 | 0.0 | 0.3 | 0.0 | 0.0 | 0.0 | 0.0 | 0.0 | 0.0 | 0.0 | 0.1 | 0.0 | 0.1 | ||
| 2011 | 0.0 | 0.2 | 0.1 | 0.1 | 0.0 | 0.3 | 0.1 | 0.1 | 0.0 | 0.1 | 0.0 | 0.0 | 0.1 | 0.1 | 0.2 | 0.0 | 0.1 | ||
| 2010 | 0.0 | 0.0 | 0.0 | 0.1 | 0.1 | 0.2 | 0.2 | 0.1 | 0.0 | 0.0 | 0.0 | 0.0 | 0.0 | 0.1 | 0.2 | 0.0 | 0.1 | ||
| 2009 | 0.0 | 0.0 | 0.0 | 0.0 | 0.0 | 0.2 | 0.0 | 0.0 | 0.0 | 0.0 | 0.1 | 0.0 | 0.0 | 0.0 | 0.1 | 0.0 | 0.0 | ||
| 2008 | 0.0 | 0.0 | 0.0 | 0.0 | 0.0 | 0.0 | 0.0 | 0.0 | 0.0 | 0.0 | 0.0 | 0.0 | 0.0 | 0.0 | 0.0 | 0.0 | 0.0 | ||
| 2007 | 0.0 | 0.0 | 0.0 | 0.0 | 0.0 | 0.0 | 0.1 | 0.0 | 0.1 | 0.0 | 0.1 | 0.1 | 0.0 | 0.0 | 0.1 | 0.1 | 0.0 | ||
| 2006 | 0.0 | 0.1 | 0.0 | 0.0 | 0.1 | 0.0 | 0.0 | 0.0 | 0.0 | 0.0 | 0.0 | 0.0 | 0.0 | 0.0 | 0.0 | 0.0 | 0.0 | ||
| 2005 | 0.0 | 0.0 | 0.0 | 0.0 | 0.1 | 0.0 | 0.0 | 0.0 | 0.0 | 0.0 | 0.0 | 0.0 | 0.0 | 0.0 | 0.0 | 0.0 | 0.0 | ||
| 2004 | 0.0 | 0.0 | 0.0 | 0.0 | 0.0 | 0.0 | 0.0 | 0.0 | 0.0 | 0.0 | 0.0 | 0.0 | 0.0 | 0.0 | 0.0 | 0.0 | 0.0 | ||
| 2003 | 0.0 | 0.0 | 0.0 | 0.0 | 0.0 | 0.0 | 0.0 | 0.0 | 0.0 | 0.0 | 0.0 | 0.0 | 0.0 | 0.0 | 0.0 | 0.0 | 0.0 | ||
| 2002 | 0.0 | 0.0 | 0.0 | 0.2 | 0.0 | 0.0 | 0.0 | 0.0 | 0.0 | 0.0 | 0.0 | 0.0 | 0.0 | 0.1 | 0.0 | 0.0 | 0.0 | ||
| 2001 | 0.0 | 0.0 | 0.0 | 0.0 | 0.1 | 0.0 | 0.0 | 0.0 | 0.0 | 0.0 | 0.0 | 0.0 | 0.0 | 0.0 | 0.0 | 0.0 | 0.0 | ||
| 2000 | 0.0 | 0.0 | 0.0 | 0.0 | 0.1 | 0.1 | 0.4 | 0.0 | 0.0 | 0.0 | 0.0 | 0.0 | 0.0 | 0.0 | 0.2 | 0.0 | 0.1 | ||
| 1999 | 0.1 | 0.1 | 0.1 | 0.0 | 0.1 | 0.1 | 0.0 | 0.0 | 0.1 | 0.0 | 0.0 | 0.0 | 0.0 | 0.1 | 0.0 | 0.0 | 0.0 | ||
| 1998 | 0.0 | 0.1 | 0.1 | 0.1 | 0.0 | 0.0 | 0.0 | 0.1 | 0.0 | 0.0 | 0.0 | 0.0 | 0.0 | 0.1 | 0.0 | 0.0 | 0.0 | ||
| 1997 | 0.0 | 0.0 | 0.2 | 0.1 | 0.0 | 0.2 | 0.0 | 0.1 | 0.0 | 0.0 | 0.0 | 0.0 | 0.0 | 0.1 | 0.2 | 0.0 | 0.1 | ||
| 1996 | 0.0 | 0.0 | 0.0 | 0.0 | 0.1 | 0.1 | 0.1 | 0.0 | 0.1 | 0.0 | 0.0 | 0.1 | 0.0 | 0.0 | 0.1 | 0.0 | 0.0 | ||
| 1995 | 0.0 | 0.0 | 0.0 | 0.0 | 0.0 | 0.0 | 0.0 | 0.0 | 0.0 | 0.0 | 0.0 | 0.0 | 0.0 | 0.0 | 0.0 | 0.0 | 0.0 | ||
| 1994 | 0.0 | 0.0 | 0.0 | 0.2 | 0.2 | 0.4 | 0.3 | 0.0 | 0.1 | 0.2 | 0.1 | 0.0 | 0.0 | 0.2 | 0.2 | 0.1 | 0.1 | ||
| 1993 | 0.0 | 0.0 | 0.0 | 0.1 | 0.0 | 0.2 | 0.0 | 0.0 | 0.1 | 0.0 | 0.0 | 0.0 | 0.0 | 0.0 | 0.1 | 0.0 | 0.0 | ||
| 1992 | 0.0 | 0.0 | 0.0 | 0.1 | 0.0 | 0.0 | 0.0 | 0.0 | 0.0 | 0.0 | 0.0 | 0.0 | 0.0 | 0.0 | 0.0 | 0.0 | 0.0 | ||
| 1991 | 0.0 | 0.0 | 0.0 | 0.0 | 0.1 | 0.0 | 0.0 | 0.0 | 0.0 | 0.0 | 0.0 | 0.0 | 0.0 | 0.0 | 0.0 | 0.0 | 0.0 | ||
| 1990 | 0.0 | 0.0 | 0.2 | 0.2 | 0.0 | 0.0 | 0.1 | 0.0 | 0.0 | 0.0 | 0.0 | 0.0 | 0.0 | 0.1 | 0.0 | 0.0 | 0.0 | ||
| 1989 | 0.0 | 0.1 | 0.0 | 0.2 | 0.4 | 0.0 | 0.0 | 0.0 | 0.0 | 0.0 | 0.0 | 0.0 | 0.0 | 0.2 | 0.0 | 0.0 | 0.1 | ||
| 1988 | 0.0 | 0.0 | 0.1 | 0.1 | 0.0 | 0.1 | 0.1 | 0.1 | 0.1 | 0.1 | 0.1 | 0.0 | 0.0 | 0.1 | 0.1 | 0.1 | 0.1 | ||
| 1987 | 0.0 | 0.0 | 0.0 | 0.1 | 0.0 | 0.0 | 0.0 | 0.0 | 0.0 | 0.0 | 0.0 | 0.0 | 0.0 | 0.0 | 0.0 | 0.0 | 0.0 | ||
| 1986 | 0.3 | 0.1 | 0.0 | 0.0 | 0.5 | 0.1 | 0.0 | 0.0 | 0.1 | 0.0 | 0.0 | 0.0 | 0.1 | 0.2 | 0.0 | 0.0 | 0.1 | ||
| 1985 | 0.0 | 0.0 | 0.1 | 0.3 | 0.1 | 0.0 | 0.0 | 0.6 | 0.0 | 0.0 | 0.2 | 0.0 | 0.0 | 0.2 | 0.1 | 0.0 | 0.1 | ||
| 1984 | 0.8 | 0.0 | 3.4 | 1.1 | 1.0 | 1.5 | 0.0 | 0.0 | 0.0 | 0.0 | 0.0 | 0.0 | 0.1 | 1.6 | 0.2 | 0.0 | 0.2 | ||
| 1983 | 1.8 | 0.0 | 0.0 | 1.2 | 2.3 | 5.2 | 0.7 | 0.0 | 0.0 | - | 0.0 | 0.0 | 0.4 | 1.3 | 2.4 | 0.0 | 1.2 | ||
| 1982 | - | 0.0 | - | 0.0 | 0.0 | 0.0 | - | 1.9 | - | 0.0 | - | 0.0 | 0.0 | 0.0 | 0.8 | 0.0 | 0.3 | ||
Reporting rates
Reporting rate is the proportion of all surveys in which the species was present.
Reporting rate by year
This chart shows the reporting rate of Banded Lapwing each year between 1982 and 2017. 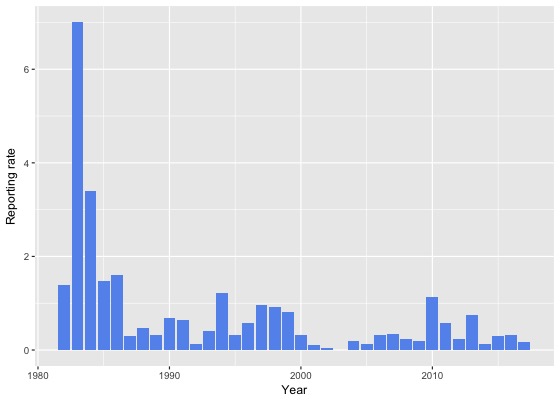
Reporting rate by month
This chart shows the reporting rate by month of Banded Lapwing. The blue lines show the reporting rate for the twelve months to June 2017 and the bars show the average reporting rate for the period 1982 to 2017. 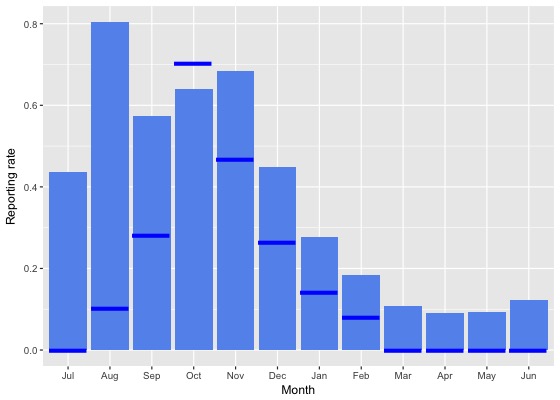
Reporting rate by season
This chart shows the seasonal reporting rate of Banded Lapwing. The blue lines show the seasonal reporting rate for the twelve months to June 2017 and the bars show the average seasonal reporting rate for the period 1982 to 2017. 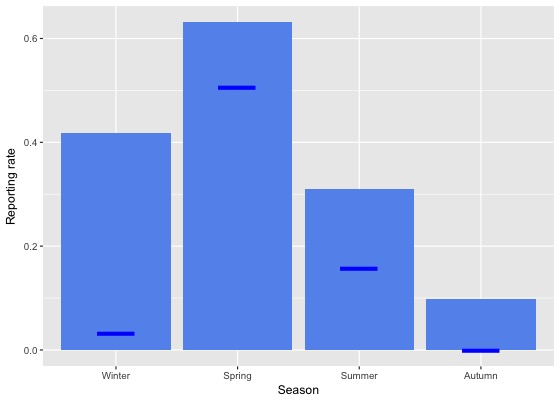
Reporting rate data
| Month | Season | ||||||||||||||||||
|---|---|---|---|---|---|---|---|---|---|---|---|---|---|---|---|---|---|---|---|
| Period | Jul | Aug | Sep | Oct | Nov | Dec | Jan | Feb | Mar | Apr | May | Jun | Winter | Spring | Summer | Autumn | All | ||
| All years | |||||||||||||||||||
| All | 0.4 | 0.8 | 0.6 | 0.6 | 0.7 | 0.4 | 0.3 | 0.2 | 0.1 | 0.1 | 0.1 | 0.1 | 0.4 | 0.6 | 0.3 | 0.1 | 0.4 | ||
| Previous years | |||||||||||||||||||
| All previous years | 0.5 | 0.9 | 0.6 | 0.6 | 0.7 | 0.5 | 0.3 | 0.2 | 0.1 | 0.1 | 0.1 | 0.1 | 0.5 | 0.6 | 0.3 | 0.1 | 0.4 | ||
| Previous 30 years | 0.4 | 0.9 | 0.6 | 0.6 | 0.7 | 0.4 | 0.3 | 0.2 | 0.1 | 0.1 | 0.1 | 0.1 | 0.5 | 0.6 | 0.3 | 0.1 | 0.4 | ||
| Previous 20 years | 0.5 | 1.1 | 0.6 | 0.6 | 0.7 | 0.3 | 0.3 | 0.1 | 0.1 | 0.1 | 0.0 | 0.1 | 0.5 | 0.6 | 0.3 | 0.1 | 0.4 | ||
| 10 year groups | |||||||||||||||||||
| [2007,2017) | 0.6 | 1.3 | 0.6 | 0.6 | 0.7 | 0.3 | 0.3 | 0.1 | 0.1 | 0.0 | 0.1 | 0.2 | 0.6 | 0.6 | 0.3 | 0.1 | 0.4 | ||
| [1997,2007) | 0.2 | 0.7 | 0.4 | 0.6 | 0.7 | 0.4 | 0.2 | 0.2 | 0.0 | 0.1 | 0.0 | 0.0 | 0.3 | 0.5 | 0.3 | 0.1 | 0.3 | ||
| [1987,1997) | 0.4 | 0.3 | 0.6 | 0.7 | 0.7 | 0.8 | 0.5 | 0.3 | 0.3 | 0.3 | 0.2 | 0.4 | 0.4 | 0.7 | 0.5 | 0.3 | 0.5 | ||
| 5 year groups | |||||||||||||||||||
| [2012,2017) | 0.7 | 1.4 | 0.7 | 0.6 | 0.6 | 0.2 | 0.2 | 0.0 | 0.0 | 0.0 | 0.0 | 0.0 | 0.7 | 0.6 | 0.1 | 0.0 | 0.3 | ||
| [2007,2012) | 0.3 | 1.3 | 0.5 | 0.6 | 0.8 | 0.6 | 0.7 | 0.6 | 0.2 | 0.1 | 0.3 | 0.4 | 0.6 | 0.6 | 0.7 | 0.2 | 0.5 | ||
| [2002,2007) | 0.0 | 0.6 | 0.1 | 0.4 | 0.3 | 0.2 | 0.0 | 0.0 | 0.0 | 0.1 | 0.0 | 0.0 | 0.2 | 0.3 | 0.1 | 0.0 | 0.1 | ||
| [1997,2002) | 0.6 | 0.8 | 0.7 | 0.8 | 1.2 | 0.7 | 0.4 | 0.3 | 0.1 | 0.1 | 0.0 | 0.0 | 0.4 | 0.9 | 0.5 | 0.1 | 0.5 | ||
| [1992,1997) | 0.3 | 0.2 | 0.3 | 0.6 | 1.0 | 1.5 | 0.5 | 0.0 | 0.7 | 0.7 | 0.3 | 0.3 | 0.3 | 0.6 | 0.7 | 0.6 | 0.5 | ||
| [1987,1992) | 0.4 | 0.4 | 0.7 | 0.8 | 0.5 | 0.5 | 0.4 | 0.4 | 0.1 | 0.1 | 0.1 | 0.4 | 0.4 | 0.7 | 0.5 | 0.1 | 0.4 | ||
| Year | |||||||||||||||||||
| 2017 | 0.0 | 0.1 | 0.3 | 0.7 | 0.5 | 0.3 | 0.1 | 0.1 | 0.0 | 0.0 | 0.0 | 0.0 | 0.0 | 0.5 | 0.2 | 0.0 | 0.2 | ||
| 2016 | 1.2 | 2.0 | 0.6 | 0.5 | 0.0 | 0.0 | 0.0 | 0.0 | 0.0 | 0.0 | 0.0 | 0.1 | 1.1 | 0.4 | 0.0 | 0.0 | 0.3 | ||
| 2015 | 0.2 | 0.2 | 0.4 | 0.5 | 1.4 | 0.4 | 0.1 | 0.1 | 0.1 | 0.0 | 0.0 | 0.0 | 0.1 | 0.7 | 0.2 | 0.0 | 0.3 | ||
| 2014 | 0.0 | 0.4 | 0.8 | 0.2 | 0.4 | 0.0 | 0.0 | 0.0 | 0.0 | 0.0 | 0.0 | 0.0 | 0.1 | 0.4 | 0.0 | 0.0 | 0.1 | ||
| 2013 | 0.9 | 3.2 | 1.4 | 1.7 | 1.0 | 0.3 | 0.8 | 0.0 | 0.0 | 0.0 | 0.0 | 0.0 | 1.3 | 1.5 | 0.4 | 0.0 | 0.8 | ||
| 2012 | 0.4 | 0.8 | 0.7 | 0.3 | 0.3 | 0.0 | 0.2 | 0.0 | 0.0 | 0.0 | 0.0 | 0.0 | 0.4 | 0.4 | 0.1 | 0.0 | 0.2 | ||
| 2011 | 0.8 | 4.0 | 1.6 | 0.6 | 0.6 | 0.3 | 0.3 | 0.5 | 0.0 | 0.3 | 0.0 | 0.3 | 1.2 | 0.9 | 0.3 | 0.1 | 0.6 | ||
| 2010 | 1.0 | 0.9 | 0.0 | 1.9 | 2.9 | 1.8 | 1.9 | 2.4 | 0.0 | 0.0 | 0.0 | 0.4 | 0.6 | 1.6 | 1.9 | 0.0 | 1.1 | ||
| 2009 | 0.0 | 0.0 | 0.4 | 0.0 | 0.0 | 0.5 | 0.0 | 0.8 | 0.5 | 0.0 | 0.8 | 0.0 | 0.0 | 0.1 | 0.4 | 0.3 | 0.2 | ||
| 2008 | 0.0 | 0.9 | 0.0 | 0.2 | 0.0 | 0.0 | 0.8 | 0.0 | 0.5 | 0.0 | 0.0 | 0.9 | 0.6 | 0.1 | 0.2 | 0.2 | 0.2 | ||
| 2007 | 0.0 | 0.0 | 0.4 | 0.2 | 0.0 | 0.3 | 0.8 | 0.0 | 0.4 | 0.4 | 0.8 | 0.3 | 0.2 | 0.2 | 0.4 | 0.5 | 0.3 | ||
| 2006 | 0.0 | 3.9 | 0.0 | 0.5 | 1.2 | 0.0 | 0.0 | 0.0 | 0.0 | 0.0 | 0.0 | 0.0 | 0.8 | 0.5 | 0.0 | 0.0 | 0.3 | ||
| 2005 | 0.0 | 0.0 | 0.0 | 0.0 | 0.7 | 0.8 | 0.0 | 0.0 | 0.0 | 0.0 | 0.0 | 0.0 | 0.0 | 0.2 | 0.4 | 0.0 | 0.1 | ||
| 2004 | 0.0 | 0.0 | 0.5 | 1.2 | 0.0 | 0.0 | 0.0 | 0.0 | 0.0 | 0.5 | 0.0 | 0.0 | 0.0 | 0.5 | 0.0 | 0.2 | 0.2 | ||
| 2003 | 0.0 | 0.0 | 0.0 | 0.0 | 0.0 | 0.0 | 0.0 | 0.0 | 0.0 | 0.0 | 0.0 | 0.0 | 0.0 | 0.0 | 0.0 | 0.0 | 0.0 | ||
| 2002 | 0.0 | 0.0 | 0.0 | 0.4 | 0.0 | 0.0 | 0.0 | 0.0 | 0.0 | 0.0 | 0.0 | 0.0 | 0.0 | 0.2 | 0.0 | 0.0 | 0.0 | ||
| 2001 | 0.4 | 0.0 | 0.3 | 0.0 | 0.6 | 0.0 | 0.0 | 0.0 | 0.0 | 0.0 | 0.0 | 0.0 | 0.2 | 0.3 | 0.0 | 0.0 | 0.1 | ||
| 2000 | 0.0 | 0.0 | 0.0 | 0.0 | 0.9 | 1.0 | 1.2 | 0.0 | 0.0 | 0.0 | 0.0 | 0.0 | 0.0 | 0.3 | 0.8 | 0.0 | 0.3 | ||
| 1999 | 2.9 | 2.1 | 1.7 | 1.3 | 2.6 | 1.2 | 0.0 | 0.0 | 0.5 | 0.0 | 0.0 | 0.0 | 0.9 | 1.8 | 0.5 | 0.2 | 0.8 | ||
| 1998 | 0.0 | 3.8 | 0.8 | 3.3 | 0.9 | 0.0 | 0.0 | 1.9 | 0.0 | 0.0 | 0.0 | 0.0 | 1.2 | 1.5 | 0.4 | 0.0 | 0.9 | ||
| 1997 | 1.1 | 0.0 | 1.8 | 1.3 | 0.9 | 1.9 | 0.0 | 1.8 | 0.0 | 0.9 | 0.0 | 0.0 | 0.5 | 1.3 | 1.4 | 0.5 | 1.0 | ||
| 1996 | 0.0 | 0.0 | 0.0 | 0.0 | 1.9 | 1.0 | 1.0 | 0.0 | 1.0 | 0.0 | 0.0 | 1.1 | 0.4 | 0.7 | 0.7 | 0.4 | 0.6 | ||
| 1995 | 1.1 | 0.8 | 0.0 | 0.0 | 0.9 | 1.1 | 0.0 | 0.0 | 0.0 | 0.0 | 0.0 | 0.0 | 0.6 | 0.3 | 0.4 | 0.0 | 0.3 | ||
| 1994 | 0.0 | 0.0 | 1.5 | 1.2 | 1.5 | 4.3 | 1.5 | 0.0 | 1.1 | 2.3 | 1.2 | 0.0 | 0.0 | 1.4 | 1.7 | 1.7 | 1.2 | ||
| 1993 | 0.0 | 0.0 | 0.0 | 1.3 | 0.0 | 2.2 | 0.0 | 0.0 | 1.2 | 0.0 | 0.0 | 0.0 | 0.0 | 0.5 | 0.8 | 0.5 | 0.4 | ||
| 1992 | 0.0 | 0.0 | 0.0 | 1.1 | 0.0 | 0.0 | 0.0 | 0.0 | 0.0 | 0.0 | 0.0 | 0.0 | 0.0 | 0.4 | 0.0 | 0.0 | 0.1 | ||
| 1991 | 0.8 | 1.1 | 1.2 | 1.0 | 1.0 | 1.4 | 0.0 | 0.0 | 0.0 | 0.0 | 0.0 | 0.0 | 0.7 | 1.0 | 0.6 | 0.0 | 0.7 | ||
| 1990 | 0.6 | 0.0 | 1.1 | 2.0 | 0.9 | 0.0 | 1.4 | 1.4 | 0.0 | 0.0 | 0.0 | 1.3 | 0.5 | 1.3 | 0.9 | 0.0 | 0.7 | ||
| 1989 | 0.0 | 0.4 | 0.9 | 0.4 | 0.5 | 0.9 | 0.0 | 0.5 | 0.0 | 0.0 | 0.0 | 0.0 | 0.2 | 0.6 | 0.5 | 0.0 | 0.3 | ||
| 1988 | 0.4 | 0.4 | 0.6 | 0.4 | 0.3 | 0.5 | 0.5 | 0.6 | 0.5 | 0.5 | 0.5 | 0.5 | 0.4 | 0.4 | 0.5 | 0.5 | 0.5 | ||
| 1987 | 0.0 | 0.0 | 0.4 | 1.2 | 0.3 | 0.0 | 0.5 | 0.0 | 0.0 | 0.0 | 0.0 | 0.5 | 0.4 | 0.6 | 0.2 | 0.0 | 0.3 | ||
| 1986 | 3.8 | 2.6 | 1.9 | 0.0 | 2.1 | 5.9 | 0.0 | 0.0 | 3.2 | 0.0 | 0.0 | 0.0 | 2.0 | 1.5 | 2.2 | 0.9 | 1.6 | ||
| 1985 | 0.0 | 0.0 | 1.9 | 2.3 | 1.8 | 0.0 | 0.0 | 5.9 | 0.0 | 0.0 | 10.0 | 0.0 | 0.0 | 2.1 | 1.2 | 2.5 | 1.5 | ||
| 1984 | 20.0 | 0.0 | 60.0 | 8.3 | 25.0 | 8.3 | 0.0 | 0.0 | 0.0 | 0.0 | 3.2 | 0.0 | 2.0 | 23.8 | 1.4 | 1.1 | 3.4 | ||
| 1983 | 16.7 | 0.0 | 0.0 | 15.4 | 11.1 | 15.4 | 16.7 | 0.0 | 0.0 | - | 0.0 | 0.0 | 3.4 | 11.1 | 10.0 | 0.0 | 7.0 | ||
| 1982 | - | 0.0 | - | 0.0 | 0.0 | 0.0 | - | 9.1 | - | 0.0 | - | 0.0 | 0.0 | 0.0 | 4.0 | 0.0 | 1.4 | ||
Breeding data
Breeding records by month
Number of breeding records by breeding code and month, 2017 and all years| Breeding code | Jul | Aug | Sep | Oct | Nov | Dec | Jan | Feb | Mar | Apr | May | Jun |
|---|---|---|---|---|---|---|---|---|---|---|---|---|
| 2017 | ||||||||||||
| Breeding (BLA code) | 0 | 0 | 0 | 0 | 0 | 0 | 0 | 0 | 0 | 0 | 0 | 0 |
| Carrying Food | 0 | 0 | 0 | 0 | 0 | 0 | 0 | 0 | 0 | 0 | 0 | 0 |
| Copulating | 0 | 0 | 0 | 0 | 0 | 0 | 0 | 0 | 0 | 0 | 0 | 0 |
| Display | 0 | 0 | 0 | 0 | 0 | 0 | 0 | 0 | 0 | 0 | 0 | 0 |
| Dependent young | 0 | 0 | 0 | 0 | 1 | 0 | 0 | 0 | 0 | 0 | 0 | 0 |
| Faecal sac | 0 | 0 | 0 | 0 | 0 | 0 | 0 | 0 | 0 | 0 | 0 | 0 |
| Inspecting hollow | 0 | 0 | 0 | 0 | 0 | 0 | 0 | 0 | 0 | 0 | 0 | 0 |
| Nest building | 0 | 0 | 0 | 0 | 0 | 0 | 0 | 0 | 0 | 0 | 0 | 0 |
| Nest with eggs | 0 | 0 | 0 | 0 | 0 | 0 | 0 | 0 | 0 | 0 | 0 | 0 |
| Nest with young | 0 | 0 | 0 | 0 | 0 | 0 | 0 | 0 | 0 | 0 | 0 | 0 |
| On/leaving nest | 0 | 0 | 0 | 0 | 1 | 0 | 0 | 0 | 0 | 0 | 0 | 0 |
| All years | ||||||||||||
| Breeding (BLA code) | 0 | 0 | 1 | 0 | 1 | 0 | 1 | 0 | 0 | 0 | 0 | 0 |
| Carrying Food | 0 | 0 | 0 | 0 | 0 | 0 | 0 | 0 | 0 | 0 | 0 | 0 |
| Copulating | 0 | 0 | 0 | 0 | 0 | 0 | 0 | 0 | 0 | 0 | 0 | 0 |
| Display | 0 | 1 | 0 | 0 | 0 | 0 | 0 | 0 | 0 | 0 | 0 | 0 |
| Dependent young | 0 | 0 | 5 | 9 | 5 | 2 | 1 | 3 | 0 | 0 | 0 | 0 |
| Faecal sac | 0 | 0 | 0 | 0 | 0 | 0 | 0 | 0 | 0 | 0 | 0 | 0 |
| Inspecting hollow | 0 | 0 | 0 | 0 | 0 | 0 | 0 | 0 | 0 | 0 | 0 | 0 |
| Nest building | 0 | 0 | 0 | 0 | 0 | 0 | 0 | 0 | 0 | 0 | 0 | 0 |
| Nest with eggs | 0 | 2 | 1 | 0 | 0 | 0 | 0 | 0 | 0 | 0 | 0 | 0 |
| Nest with young | 0 | 0 | 0 | 0 | 0 | 0 | 0 | 0 | 0 | 0 | 0 | 0 |
| On/leaving nest | 0 | 2 | 1 | 3 | 1 | 0 | 0 | 0 | 1 | 0 | 0 | 0 |
Breeding records by year
Average number of breeding records per period by breeding code| Period | Breeding (BLA code) | Carrying Food | Copulating | Display | Dependent young | Faecal sac | Inspecting hollow | Nest building | Nest with eggs | Nest with young | On/leaving nest |
|---|---|---|---|---|---|---|---|---|---|---|---|
| All years | |||||||||||
| All | 0.1 | 0.0 | 0.0 | 0.0 | 0.7 | 0.0 | 0.0 | 0.0 | 0.1 | 0.0 | 0.2 |
| Previous years | |||||||||||
| All previous years | 0.1 | 0.0 | 0.0 | 0.0 | 0.7 | 0.0 | 0.0 | 0.0 | 0.1 | 0.0 | 0.2 |
| Previous 30 years | 0.1 | 0.0 | 0.0 | 0.0 | 0.7 | 0.0 | 0.0 | 0.0 | 0.1 | 0.0 | 0.2 |
| Previous 20 years | 0.1 | 0.0 | 0.0 | 0.0 | 0.9 | 0.0 | 0.0 | 0.0 | 0.1 | 0.0 | 0.3 |
| 10 year groups | |||||||||||
| [2007,2017) | 0.2 | 0.0 | 0.0 | 0.1 | 1.8 | 0.0 | 0.0 | 0.0 | 0.3 | 0.0 | 0.7 |
| [1997,2007) | 0.1 | 0.0 | 0.0 | 0.0 | 0.0 | 0.0 | 0.0 | 0.0 | 0.0 | 0.0 | 0.0 |
| [1987,1997) | 0.0 | 0.0 | 0.0 | 0.0 | 0.4 | 0.0 | 0.0 | 0.0 | 0.0 | 0.0 | 0.0 |
| 5 year groups | |||||||||||
| [2012,2017) | 0.0 | 0.0 | 0.0 | 0.2 | 1.6 | 0.0 | 0.0 | 0.0 | 0.0 | 0.0 | 0.4 |
| [2007,2012) | 0.4 | 0.0 | 0.0 | 0.0 | 2.0 | 0.0 | 0.0 | 0.0 | 0.6 | 0.0 | 1.0 |
| [2002,2007) | 0.0 | 0.0 | 0.0 | 0.0 | 0.0 | 0.0 | 0.0 | 0.0 | 0.0 | 0.0 | 0.0 |
| [1997,2002) | 0.2 | 0.0 | 0.0 | 0.0 | 0.0 | 0.0 | 0.0 | 0.0 | 0.0 | 0.0 | 0.0 |
| [1992,1997) | 0.0 | 0.0 | 0.0 | 0.0 | 0.0 | 0.0 | 0.0 | 0.0 | 0.0 | 0.0 | 0.0 |
| [1987,1992) | 0.0 | 0.0 | 0.0 | 0.0 | 0.8 | 0.0 | 0.0 | 0.0 | 0.0 | 0.0 | 0.0 |
| Year | |||||||||||
| 2017 | 0.0 | 0.0 | 0.0 | 0.0 | 1.0 | 0.0 | 0.0 | 0.0 | 0.0 | 0.0 | 1.0 |
| 2016 | 0.0 | 0.0 | 0.0 | 1.0 | 2.0 | 0.0 | 0.0 | 0.0 | 0.0 | 0.0 | 0.0 |
| 2015 | 0.0 | 0.0 | 0.0 | 0.0 | 5.0 | 0.0 | 0.0 | 0.0 | 0.0 | 0.0 | 0.0 |
| 2014 | 0.0 | 0.0 | 0.0 | 0.0 | 0.0 | 0.0 | 0.0 | 0.0 | 0.0 | 0.0 | 0.0 |
| 2013 | 0.0 | 0.0 | 0.0 | 0.0 | 1.0 | 0.0 | 0.0 | 0.0 | 0.0 | 0.0 | 2.0 |
| 2012 | 0.0 | 0.0 | 0.0 | 0.0 | 0.0 | 0.0 | 0.0 | 0.0 | 0.0 | 0.0 | 0.0 |
| 2011 | 0.0 | 0.0 | 0.0 | 0.0 | 2.0 | 0.0 | 0.0 | 0.0 | 3.0 | 0.0 | 2.0 |
| 2010 | 2.0 | 0.0 | 0.0 | 0.0 | 8.0 | 0.0 | 0.0 | 0.0 | 0.0 | 0.0 | 1.0 |
| 2009 | 0.0 | 0.0 | 0.0 | 0.0 | 0.0 | 0.0 | 0.0 | 0.0 | 0.0 | 0.0 | 0.0 |
| 2008 | 0.0 | 0.0 | 0.0 | 0.0 | 0.0 | 0.0 | 0.0 | 0.0 | 0.0 | 0.0 | 0.0 |
| 2007 | 0.0 | 0.0 | 0.0 | 0.0 | 0.0 | 0.0 | 0.0 | 0.0 | 0.0 | 0.0 | 2.0 |
| 2006 | 0.0 | 0.0 | 0.0 | 0.0 | 0.0 | 0.0 | 0.0 | 0.0 | 0.0 | 0.0 | 0.0 |
| 2005 | 0.0 | 0.0 | 0.0 | 0.0 | 0.0 | 0.0 | 0.0 | 0.0 | 0.0 | 0.0 | 0.0 |
| 2004 | 0.0 | 0.0 | 0.0 | 0.0 | 0.0 | 0.0 | 0.0 | 0.0 | 0.0 | 0.0 | 0.0 |
| 2003 | 0.0 | 0.0 | 0.0 | 0.0 | 0.0 | 0.0 | 0.0 | 0.0 | 0.0 | 0.0 | 0.0 |
| 2002 | 0.0 | 0.0 | 0.0 | 0.0 | 0.0 | 0.0 | 0.0 | 0.0 | 0.0 | 0.0 | 0.0 |
| 2001 | 0.0 | 0.0 | 0.0 | 0.0 | 0.0 | 0.0 | 0.0 | 0.0 | 0.0 | 0.0 | 0.0 |
| 2000 | 0.0 | 0.0 | 0.0 | 0.0 | 0.0 | 0.0 | 0.0 | 0.0 | 0.0 | 0.0 | 0.0 |
| 1999 | 1.0 | 0.0 | 0.0 | 0.0 | 0.0 | 0.0 | 0.0 | 0.0 | 0.0 | 0.0 | 0.0 |
| 1998 | 0.0 | 0.0 | 0.0 | 0.0 | 0.0 | 0.0 | 0.0 | 0.0 | 0.0 | 0.0 | 0.0 |
| 1997 | 0.0 | 0.0 | 0.0 | 0.0 | 0.0 | 0.0 | 0.0 | 0.0 | 0.0 | 0.0 | 0.0 |
| 1996 | 0.0 | 0.0 | 0.0 | 0.0 | 0.0 | 0.0 | 0.0 | 0.0 | 0.0 | 0.0 | 0.0 |
| 1995 | 0.0 | 0.0 | 0.0 | 0.0 | 0.0 | 0.0 | 0.0 | 0.0 | 0.0 | 0.0 | 0.0 |
| 1994 | 0.0 | 0.0 | 0.0 | 0.0 | 0.0 | 0.0 | 0.0 | 0.0 | 0.0 | 0.0 | 0.0 |
| 1993 | 0.0 | 0.0 | 0.0 | 0.0 | 0.0 | 0.0 | 0.0 | 0.0 | 0.0 | 0.0 | 0.0 |
| 1992 | 0.0 | 0.0 | 0.0 | 0.0 | 0.0 | 0.0 | 0.0 | 0.0 | 0.0 | 0.0 | 0.0 |
| 1991 | 0.0 | 0.0 | 0.0 | 0.0 | 0.0 | 0.0 | 0.0 | 0.0 | 0.0 | 0.0 | 0.0 |
| 1990 | 0.0 | 0.0 | 0.0 | 0.0 | 0.0 | 0.0 | 0.0 | 0.0 | 0.0 | 0.0 | 0.0 |
| 1989 | 0.0 | 0.0 | 0.0 | 0.0 | 2.0 | 0.0 | 0.0 | 0.0 | 0.0 | 0.0 | 0.0 |
| 1988 | 0.0 | 0.0 | 0.0 | 0.0 | 1.0 | 0.0 | 0.0 | 0.0 | 0.0 | 0.0 | 0.0 |
| 1987 | 0.0 | 0.0 | 0.0 | 0.0 | 1.0 | 0.0 | 0.0 | 0.0 | 0.0 | 0.0 | 0.0 |
| 1986 | 0.0 | 0.0 | 0.0 | 0.0 | 0.0 | 0.0 | 0.0 | 0.0 | 0.0 | 0.0 | 0.0 |
| 1985 | 0.0 | 0.0 | 0.0 | 0.0 | 0.0 | 0.0 | 0.0 | 0.0 | 0.0 | 0.0 | 0.0 |
| 1984 | 0.0 | 0.0 | 0.0 | 0.0 | 1.0 | 0.0 | 0.0 | 0.0 | 0.0 | 0.0 | 0.0 |
| 1983 | 0.0 | 0.0 | 0.0 | 0.0 | 1.0 | 0.0 | 0.0 | 0.0 | 0.0 | 0.0 | 0.0 |
| 1982 | 0.0 | 0.0 | 0.0 | 0.0 | 0.0 | 0.0 | 0.0 | 0.0 | 0.0 | 0.0 | 0.0 |
Distribution map
Distribution - 2017
This map shows the observed distribution of the Banded Lapwing for 2017.
The red circles are the grid cells where Banded Lapwing have been reported.
The transparency of the red circles indicate how many surveys sheets were submitted for that grid cell; the darker the red the more reliable the data. Of the 315 grid cells with reports, 83 had only one sheet; an example is grid number A11.
The size of the circle represents the reporting rate. The maximum reporting rate for Banded Lapwing was 58.8% (eg grid number Y8) and the minimum was 8.7% (eg grid number T9). 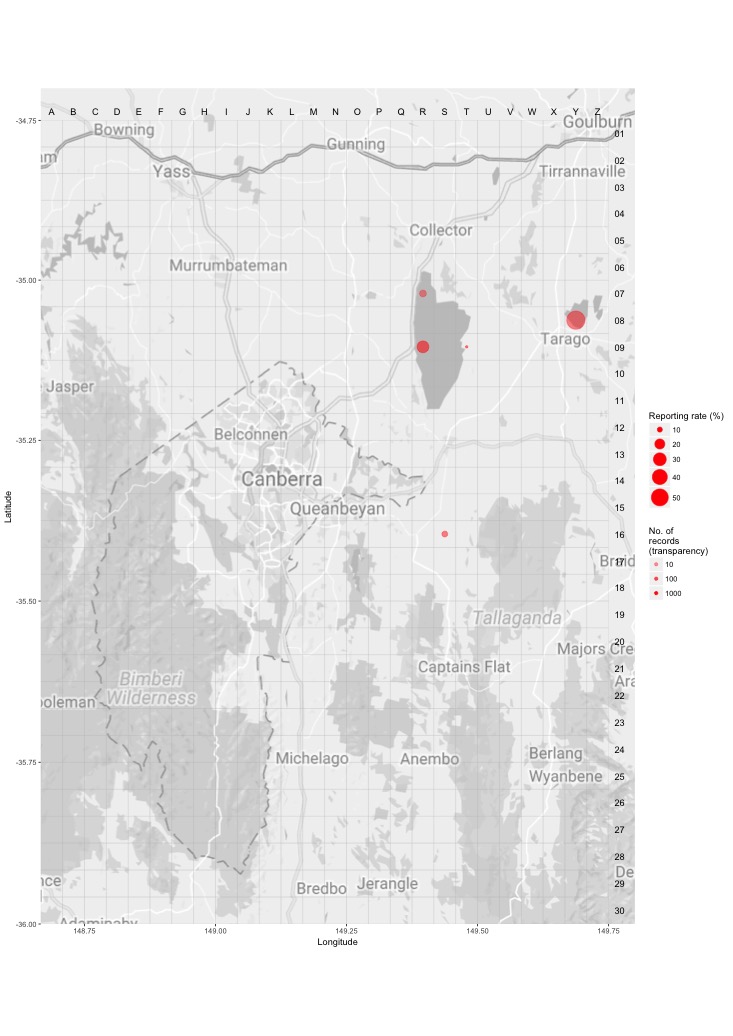
Distribution - all years
This map shows the observed distribution of the Banded Lapwing for all years.
The red circles are the grid cells where Banded Lapwing have been reported.
The transparency of the red circles indicate how many surveys sheets were submitted for that grid cell; the darker the red the more reliable the data. Of the 703 grid cells with reports, 55 had only one sheet; an example is grid number A12.
The size of the circle represents the reporting rate. The maximum reporting rate for Banded Lapwing was 25.6% (eg grid number S16) and the minimum was 0.0% (eg grid number K16). 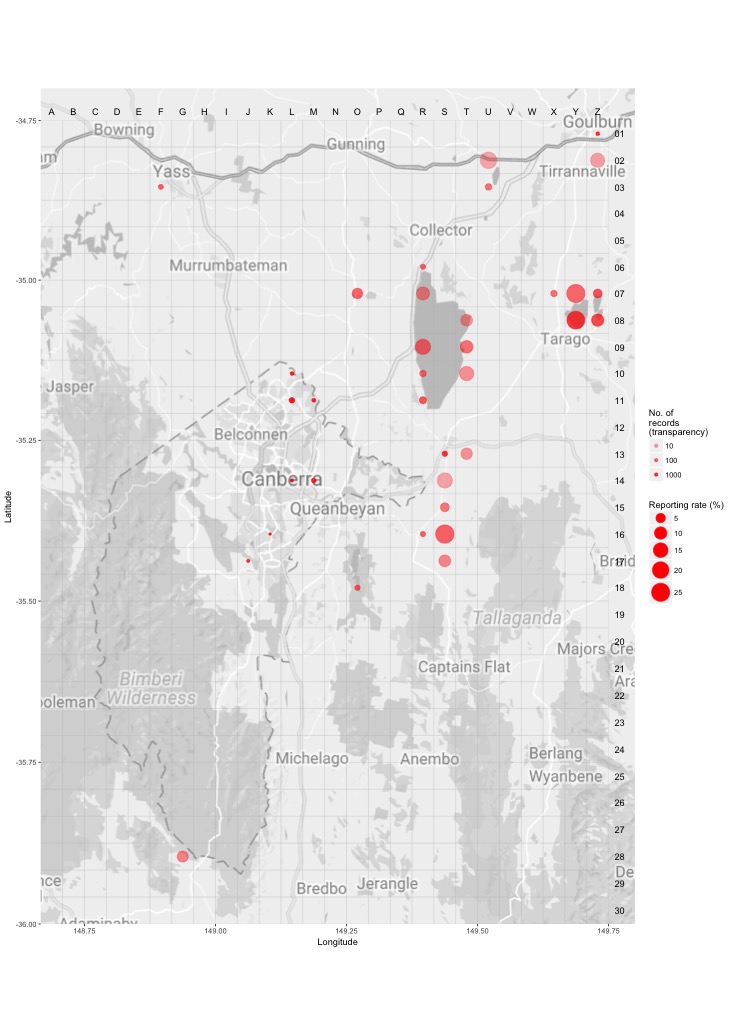
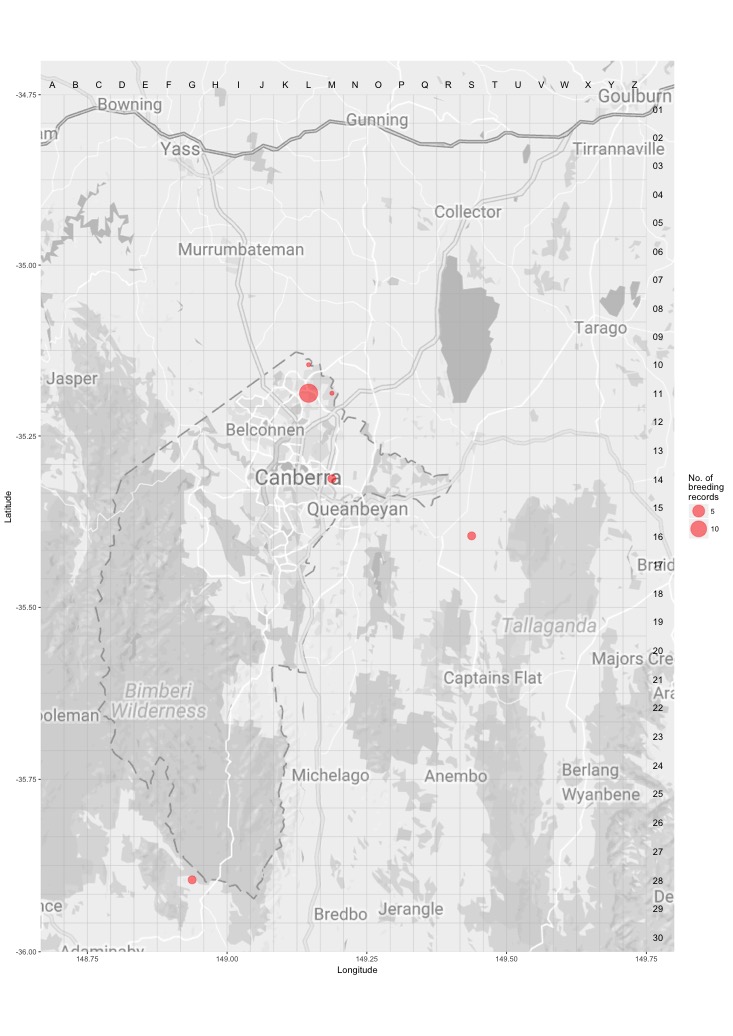
Breeding map
Breeding - 2017
This map shows the breeding distribution of the Banded Lapwing for 2017.
The red circles are the grid cells where breeding activity for Banded Lapwing have been reported.
The size of the circle represents the number of reports. 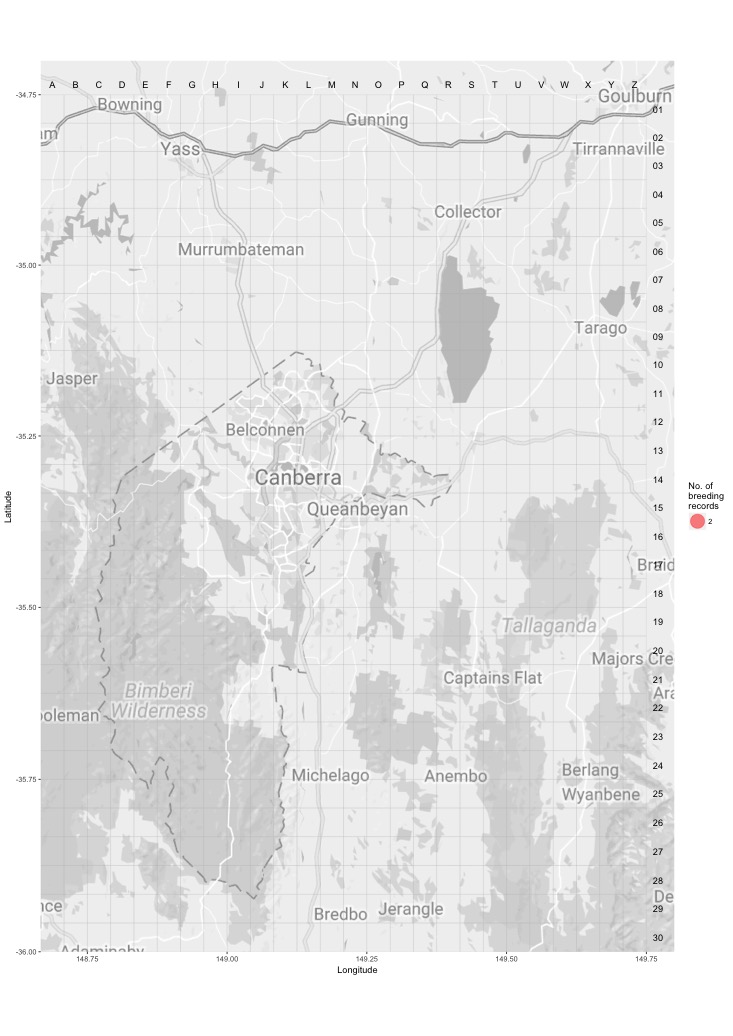
Breeding - all years
This map shows the breeding distribution of the Banded Lapwing for all years.
The red circles are the grid cells where breeding activity for Banded Lapwing have been reported.
The size of the circle represents the number of reports.